


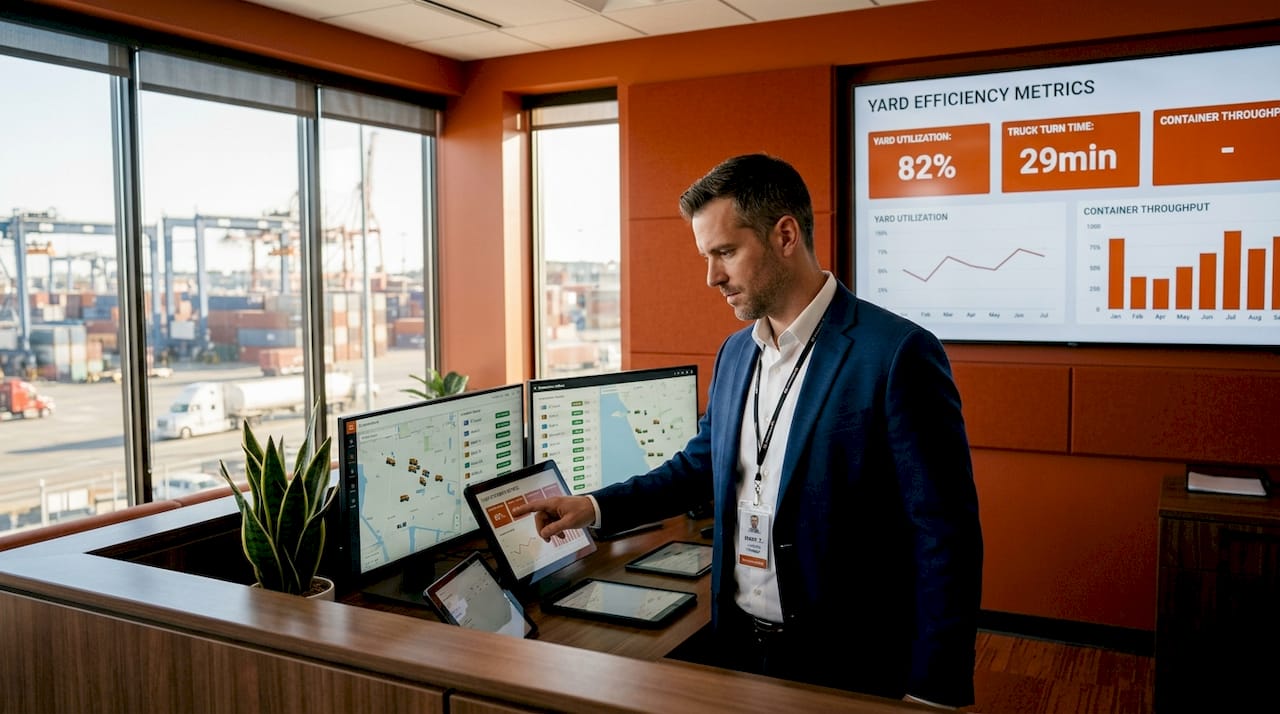
Depot Operational Efficiency: A 2026 Guide for Logistics Pros
Depot operational efficiency is the degree to which a logistics depot converts its labor, equipment, space, and processes into maximized container throughput while minimizing delays, idle capacity, and errors. Measured through KPIs like trailer dwell time, truck turnaround time, gate throughput, and dock utilization, this concept sits at the core of every high-performing container operation. Yard Management Systems (YMS) and platforms like Containerhub give depot managers the data infrastructure to track these metrics in real time. Understanding what drives or undermines these numbers is the difference between a depot that scales and one that bleeds cost.
What is depot operational efficiency and how is it measured?
Depot operational efficiency measures the conversion of labor, equipment, space, and processes into throughput while minimizing waste such as delays and idle capacity. The measurement runs from gate-in to gate-out and covers every handoff in between, including dock execution, yard moves, and inspection workflows. Efficiency is not a single number. It is a composite of time, cost, and quality metrics that together reveal how well a depot performs against its own capacity.
The industry standard for measuring operational performance in depots relies on five core KPIs: trailer dwell time, truck turnaround time, gate throughput, dock door utilization, and spotter productivity. Each metric answers a specific operational question. Dwell time tells you whether trucks are sitting too long. Turnaround time reveals whether your gate and dock processes are fast enough. Dock utilization shows whether your physical capacity is being used or wasted.
Operational efficiency means maximizing outputs while minimizing inputs without sacrificing quality, which requires tracking throughput, cost, time, and quality simultaneously. A depot that moves 200 containers per shift with three equipment breakdowns is not efficient. One that moves 180 containers with zero rework and accurate billing is closer to the target. The distinction matters because optimizing for speed alone creates downstream errors that cost more to fix than the time saved.
For fleet managers overseeing container returns and releases, understanding depot productivity starts with knowing your baseline on each of these KPIs. Without a baseline, any improvement effort is directional at best.
What are the key metrics used to measure depot efficiency?
Key yard efficiency KPIs include trailer dwell time, truck turnaround time, gate throughput, dock utilization, and spotter productivity. These metrics link directly to cost and throughput, answering whether trucks stay too long, whether yards are congested, and whether docks sit idle. Each KPI has a distinct formula and a distinct lever for improvement.
Here is how the most critical depot efficiency metrics compare across depot types:
| KPI | Small Depot Target | Large Depot Target | What it reveals |
|---|---|---|---|
| Gate turnaround time | Under 12 minutes | Under 15 minutes | Gate process speed and staffing |
| Trailer dwell time | Under 4 hours | Under 8 hours | Yard congestion and scheduling |
| Dock door utilization | 75%+ | 85%+ | Physical capacity usage |
| Spotter productivity | 20+ moves/shift | 35+ moves/shift | Internal yard labor efficiency |
| Idle container alert | 15+ days trigger | 15+ days trigger | Asset utilization and cost exposure |
Beyond these headline numbers, reason-code segmentation of dwell time reveals whether delays are caused by gate capacity, dock availability, spotter productivity, or appointment scheduling. This segmentation converts a high-level KPI into a specific root cause. Without it, a depot manager sees that dwell time is high but cannot tell whether the problem is at the gate, in the yard, or at the dock.
Dock-to-stock time adds another layer of precision. Dock-to-stock time measures elapsed time from dock arrival to stock availability in the warehouse management system, exposing true delay causes in inbound flow. For container depots processing inbound empties, the equivalent metric tracks time from gate-in to yard slot assignment. That number tells you whether your intake process is a bottleneck or a strength.
Pro Tip: Track each KPI by reason code from day one. A single “dwell time” number hides whether your problem is gate staffing, dock scheduling, or spotter availability. Segmented data cuts your diagnostic time by more than half.
How do yard management systems impact operational performance in depots?
Yard management systems improve inbound and outbound volume and reduce delays by managing scheduling and resources effectively. The yard is a supply chain bottleneck, and a YMS addresses that bottleneck by giving depot operators real-time visibility into trailer locations, dock assignments, and spotter tasks. Without a YMS, coordination happens through phone calls, whiteboards, and manual logs, all of which introduce lag and error.
A modern YMS handles four core functions: appointment scheduling, resource allocation, real-time asset tracking, and performance reporting. Scheduling eliminates the arrival clustering that causes gate queues. Resource allocation ensures spotters and forklifts are assigned before a truck arrives, not after. Real-time tracking removes the “where is that trailer?” calls that consume dispatcher time. Performance reporting feeds the KPI dashboard that depot managers use to make decisions.
Integration with Transport Management Systems (TMS) and container tracking platforms extends the value further. When a YMS shares data with a TMS, inbound appointment windows tighten because the depot knows exactly when a truck will arrive. When it connects to container yard software, every gate event, yard move, and inspection is logged automatically, creating an audit trail that supports billing accuracy and dispute resolution.
Incorrect timestamp definitions mask true bottlenecks and cause misdirected improvement efforts. This is the most common data quality failure in depot operations. If your system records “arrival” as the moment a truck enters the gate queue rather than the moment it clears the gate, your turnaround time calculation is wrong, and every intervention based on that number is aimed at the wrong problem.
Pro Tip: Audit your timestamp definitions before you benchmark any KPI. Confirm that “arrival,” “dock assignment,” and “departure” are captured at the correct process step in your YMS. One misconfigured timestamp can invalidate months of performance data.
What operational practices improve depot efficiency beyond technology?
Technology sets the ceiling for what is possible. Operational practices determine how close you get to it. Layout optimization, workflow design, and tracking synergy reduce rehandling and equipment repositioning, which are major drivers of depot turnaround times. Grouping containers by shipping line, size, and release status in designated yard slots cuts the distance a spotter travels per move. That reduction compounds across hundreds of daily moves into significant time and fuel savings.
Operational policies like retrieval and remarshalling schedules impact truck turnaround time by influencing resource contention for cranes and yard assets. Yard control logic often dominates performance, sometimes more than gate or dock processes. A depot with a fast gate but a poorly sequenced remarshalling schedule will still produce long dwell times because cranes are tied up repositioning containers when a truck is waiting for a release.
Setting clear dwell and turnaround thresholds and closing the feedback loop through live digital tracking prevents invisible coordination losses. The threshold is not just a target. It is a trigger. When dwell time crosses 15 days for an idle container, the system should alert a manager automatically, not wait for a weekly report.
Here are the depot management best practices that consistently produce measurable efficiency gains:
- Set explicit KPI thresholds for gate turnaround (sub-12 minutes for small sites), dwell time, and idle container alerts, and enforce them through automated notifications.
- Implement yard slotting by container category to reduce spotter travel distance and double-handling on every shift.
- Segment all delay KPIs by reason code so that management interventions target the actual constraint rather than the symptom.
- Align inbound appointment windows with dock availability to prevent arrival clustering that creates gate queues and yard congestion.
- Audit remarshalling schedules weekly to prevent crane contention from becoming the hidden bottleneck in your turnaround time.
- Train staff on data entry discipline because a YMS is only as accurate as the timestamps and status updates your team enters into it.
Explore common empty container management challenges to see how these practices apply to specific depot scenarios.
How does depot efficiency connect to cost control and supply chain performance?
Cost per order and throughput per labor hour are key operational efficiency measures alongside order cycle time and picking accuracy. In a container depot context, the equivalent metrics are cost per container move and throughput per spotter shift. When dwell time drops, cost per move drops with it because the same labor and equipment processes more containers in the same time window.
Reducing turnaround time has a direct financial consequence beyond labor cost. Carriers charge detention fees when trucks wait beyond agreed free time windows. A depot that consistently delivers sub-12-minute gate turnarounds eliminates most detention exposure and builds a reputation that attracts higher-volume carrier relationships. That reputation translates into volume, which improves asset utilization across the yard.
Here is how efficiency level affects key performance outcomes:
| Outcome | Low efficiency depot | High efficiency depot |
|---|---|---|
| Gate turnaround time | 20+ minutes | Under 12 minutes |
| Detention fee exposure | High, frequent | Minimal, rare |
| Throughput per shift | Below capacity | At or above target |
| Billing accuracy | Manual, error-prone | Automated, auditable |
| Carrier satisfaction | Inconsistent | Consistently high |
Operational efficiency metrics also provide the benchmarks needed for continuous improvement. A depot that tracks KPIs weekly can identify a deteriorating trend in spotter productivity before it becomes a throughput crisis. One that reviews metrics monthly is always reacting to problems that have already cost money. The cadence of measurement determines the speed of response.
For a deeper look at how these numbers connect to depot operations, the depot KPIs guide from Containerhub covers the formulas and targets in detail.
Key takeaways
Depot operational efficiency requires accurate KPI measurement, segmented by reason code, supported by a YMS, and enforced through clear operational thresholds to produce consistent throughput gains and cost reductions.
| Point | Details |
|---|---|
| Define efficiency precisely | Measure gate-in to gate-out throughput against labor, equipment, and space consumed. |
| Track the right KPIs | Trailer dwell time, turnaround time, dock utilization, and spotter productivity are the core metrics. |
| Segment delay data | Reason-code segmentation turns a high-level KPI into a specific, fixable root cause. |
| Set and enforce thresholds | Sub-12-minute gate turnaround and 15-day idle container alerts are proven operational triggers. |
| Connect metrics to cost | Lower dwell time directly reduces detention fees, labor cost per move, and carrier friction. |
Why most depots measure efficiency wrong
After working with depot operators across multiple container markets, the pattern I see most often is not a lack of data. It is a lack of precision in how that data is defined. A depot will report a 14-minute gate turnaround and feel confident, then discover that their timestamp for “arrival” is captured when the driver checks in at the booth, not when the truck enters the queue. The real turnaround is 22 minutes. Every decision made on the 14-minute number is wrong.
The second failure I see consistently is treating efficiency as a technology problem when it is equally a workforce problem. A YMS does not improve spotter productivity if spotters are not trained to update task status in real time. Automation handles the logic. Humans handle the execution. When the two are misaligned, the system reports clean data while the yard operates on chaos.
The third issue is the gap between measurement and decision-making. Depots that track KPIs but review them monthly are not managing efficiency. They are documenting it after the fact. The depots that actually improve quarter over quarter are the ones where a supervisor can pull up yesterday’s reason-code breakdown at the morning meeting and redirect two spotters before the first truck arrives.
Efficiency gains are not won in the software configuration. They are won in the daily discipline of acting on what the data says, quickly and specifically.
— William Carley
How Containerhub helps you hit your efficiency targets
Containerhub is built specifically for container depot operators who need more than a spreadsheet and a whiteboard to manage gate flows, yard positions, and KPI reporting. The platform digitizes gate-in and gate-out events, automates damage inspection workflows, and tracks container status in real time, giving your team the data accuracy that makes KPI measurement reliable rather than approximate.
With Containerhub’s container depot software, depot managers get automated idle container alerts, gate turnaround tracking, and billing integration in a single platform. The AI copilot, Jarvis, surfaces bottlenecks before they become delays, so your team acts on data rather than instinct. If you are ready to move from manual coordination to digital depot management, Containerhub is the platform built for that transition.
FAQ
What is depot operational efficiency in simple terms?
Depot operational efficiency is the measure of how effectively a depot converts its resources, including labor, equipment, and space, into container throughput while minimizing delays and waste. It is assessed through KPIs tracked from gate-in to gate-out.
What are the most important depot efficiency metrics?
Trailer dwell time, truck turnaround time, gate throughput, dock door utilization, and spotter productivity are the five core yard efficiency KPIs. Each metric targets a specific process stage and links directly to cost and throughput outcomes.
How does a yard management system improve depot efficiency?
A YMS improves efficiency by managing appointment scheduling, resource allocation, and real-time asset tracking, which reduces arrival clustering, eliminates manual coordination delays, and feeds accurate data into KPI dashboards.
What is a good gate turnaround time for a container depot?
Operational efficiency targets set sub-12 minutes as the gate turnaround benchmark for small container depots, with larger sites targeting under 15 minutes. Consistently exceeding these thresholds signals a gate staffing or process constraint.
Why does reason-code segmentation matter for depot KPIs?
Reason-code segmentation reveals whether a dwell time problem originates at the gate, the dock, or in spotter scheduling, converting a single aggregate number into a specific, fixable root cause rather than a general performance complaint.